

COVID boosted 10-14 year-old UK kids have died at a rate of 1 child per 346 person-years if boosted at least 21 days prior. That's over 1,000 times the pre-vax measles death rate.
The UK ONS stats for the "triple-jabbed or boosted" are HORRIFYING. So why does the CDC continue to recommend the jabs for kids?

Welcome to Plagiarize This Post. The reason for the name is a pre-emptive strike against censorship. My aim is to analyze key information from the most official government and/or peer-reviewed journal sources whenever possible, and showing my work.
To that end, I discourage people from simply linking this post on sites that censor and downgrade such controversial info they don’t want people to see. Copy and paste it instead, citing official sources that cannot be dismissed out of hand as “misinformation,” simply on account of the source.
Please correct any errors you observe, so I can edit them, or provide better data if you’re aware of any. This is an interactive analysis.
First, a disclaimer: comparisons of jabbbed and unjabbed populations are bound to have certain inherent biases, depending upon the characteristics of of the populations. See appendix 2 for a deeper dive into this matter.
The latest statistics on the COVID jabs from the UK Office of National Statistics, Deaths by Vaccination Status in England as of this post (for the period of January 1, 2021 to May 31, 2022) show that 10-14 year-old children in England and Wales who have been “triple vaccinated or boosted” at least 21 days previously have died at a rate corresponding to 1 out of 346 per person-year, or 2,890 per million per year. That is an absolutely horrifying death toll. (2)
In order to figure out the rates, I downloaded and edited their spreadsheet by adding columns for the calculated rates and ratios, which were not displayed. The death rates per million person-years for the kids “involving COVID-19” (whatever that means), “non-COVID-19”, and by all causes are in columns G through I, respectively. The corresponding ratios compared to the unjabbed rates are in columns J through L, respectively, and the number of person-years per death figure is in column M, to give an idea of the frequency of deaths among a given population
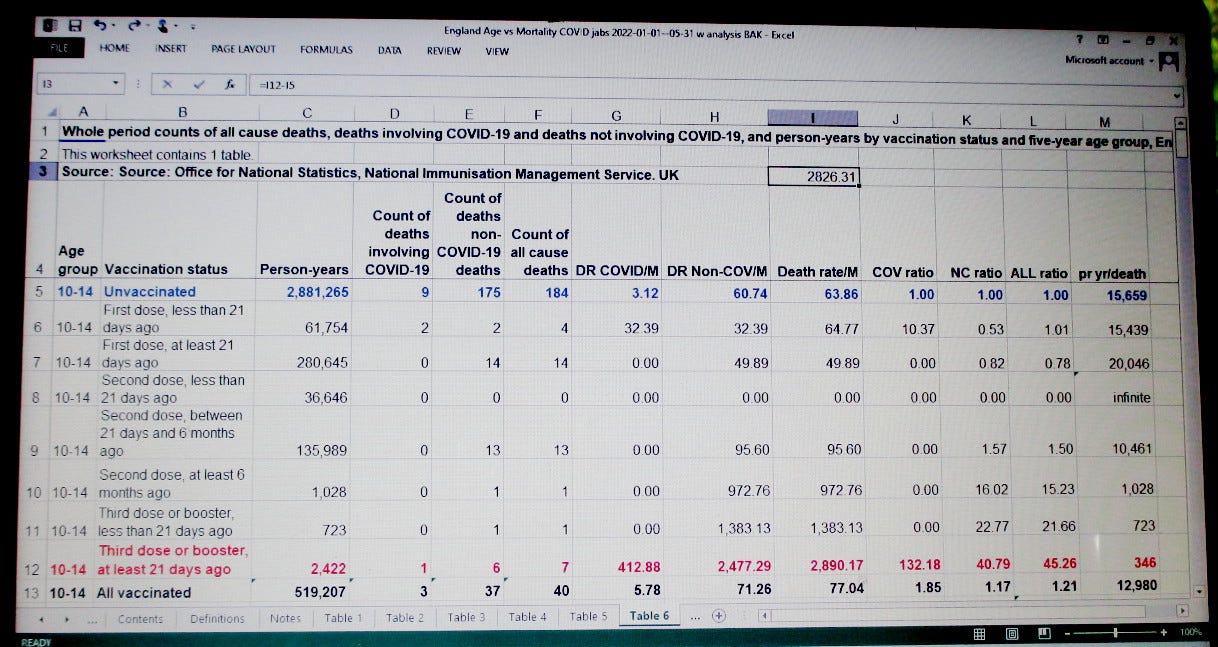
Reference: Office of National Statistics, Deaths by Vaccination Status in England as of this post, for the period of January 1, 2021 to May 31, 2022, table 6
https://www.ons.gov.uk/peoplepopulationandcommunity/birthsdeathsandmarriages/deaths/datasets/deathsbyvaccinationstatusengland (2)
Let that sink in for a moment. The difference between the death rates of the boosted and unjabbed 10 to 14 year-old kids corresponds to about 4 deaths per year among a school of 1,400. I remember only one schoolmate having died in 12 years of school with a comparable number of pupils, and that was due to an accident. How long will this holocaust go unnoticed?
The death rates for these kids within 21 days of the first jab or at least 21 days from having been boosted when COVID was diagnosed and for those who got a 2nd dose at least 6 months ago or third dose or booster up to 21 days prior were also many times higher than the unjabbed kids; but those were very small samples, with only 1 or 2 death each, so I would not read anything into those figures, but rather, keep a watchful eye on them if kids continue getting these jabs.
However, the death rates generally shoot up sharply after multiple jabs – which is most consistent with the jabs further damaging the immune systems of these kids.
To the UK’s credit, they no longer recommend the COVID jabs for all children. But they still recommend the jabs for children with poorly functioning immune systems, when the data indicate being boosted could very well render them more susceptible.
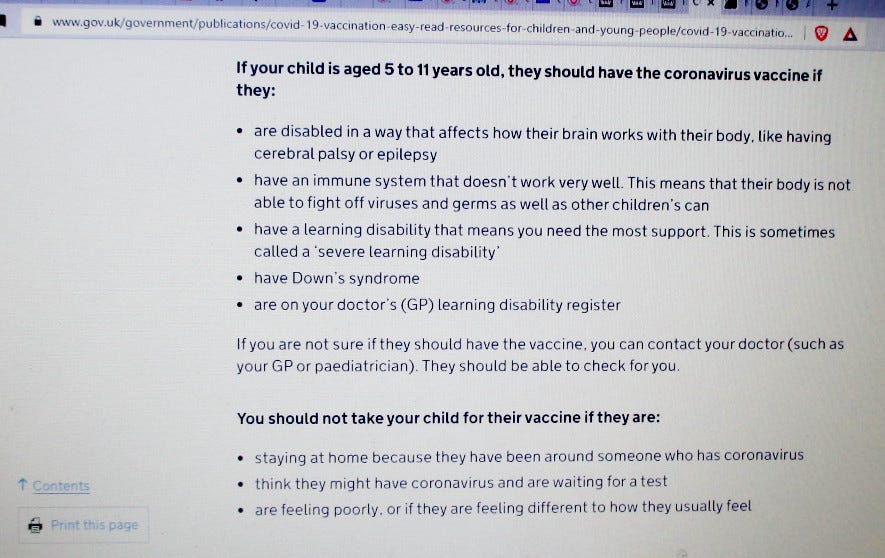
https://www.gov.uk/government/publications/covid-19-vaccination-easy-read-resources-for-children-and-young-people/covid-19-vaccination-an-easy-read-guide-for-at-risk-children-and-young-people-aged-12-to-15-years
But the US Center for Disease Control (CDC), who should be aware of these figures, still recommends these jabs for just about all children who are 14 years old and even younger. Why haven’t they updated this in light of the new figures as of this post?
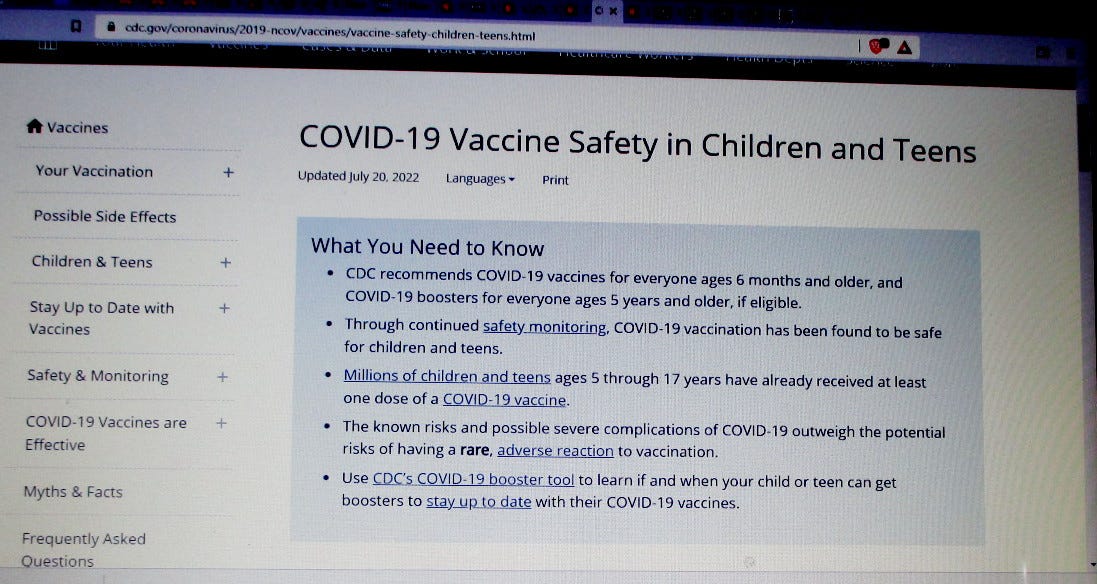
https://www.cdc.gov/coronavirus/2019-ncov/vaccines/vaccine-safety-children-teens.html
https://www.cdc.gov/coronavirus/2019-ncov/vaccines/booster-shot.html/
And I’m unaware of any such statistics as the UK provides regarding the comparative health outcomes of the jabbed and unjabbed populations of specific age groups being available to the public here in the US. Why?
As many of you are probably aware, isolated outbreaks of measles, in which none have died, have been the typical justification for the elimination of exemptions such as religious exemptions in places like New York, in the US.
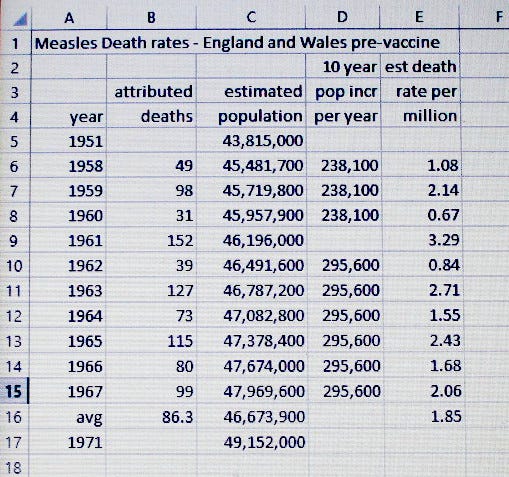
By comparison, even the difference of the death rates for these boosted kids and the unjabbed 10-14 year-old kids (2,826 deaths per million per year) is over 1,000 times the death rate attributed to measles for the entire population of England and Wales, including the elderly, just prior to the introduction of the measles vaccine in the UK in 1968, which averaged 1.85 deaths per million per year for the 10 years preceding the introduction of the vaccine (see Appendix 1 for the calculation).
If governments, politicians, and the media so up in arms to carry out witch hunts on those who choose not to vaccinate their children on account of these isolated measles outbreaks, where is the concern for an epidemic over 1,000 times greater than the disease was before the vaccine even came into use?
Acknowledgement
The inspiration for this was an article The Expose’ about data from the UK showing higher COVID death rates among children that got COVID jabs than those who did not. I decided to investigate and analyze the data for myself, and present it as clearly as possible, and show my work. Unfortunately, the ONS web site does not display the stats, which must be downloaded. Much thanks to The Expose’ for the UK Office of National Statistics (ONS) download link from which I downloaded the data.
Appendix 1: Measles rate calculation
Here is my calculation of the measles death rate for the decade preceding the introduction of the measles vaccine in 1968 (https://vk.ovg.ox.ac.uk/vk/measles). I interpolated the population estimates from the 1951, 1961 and 1971 figures I was able to find.
Deaths attributed to measles:
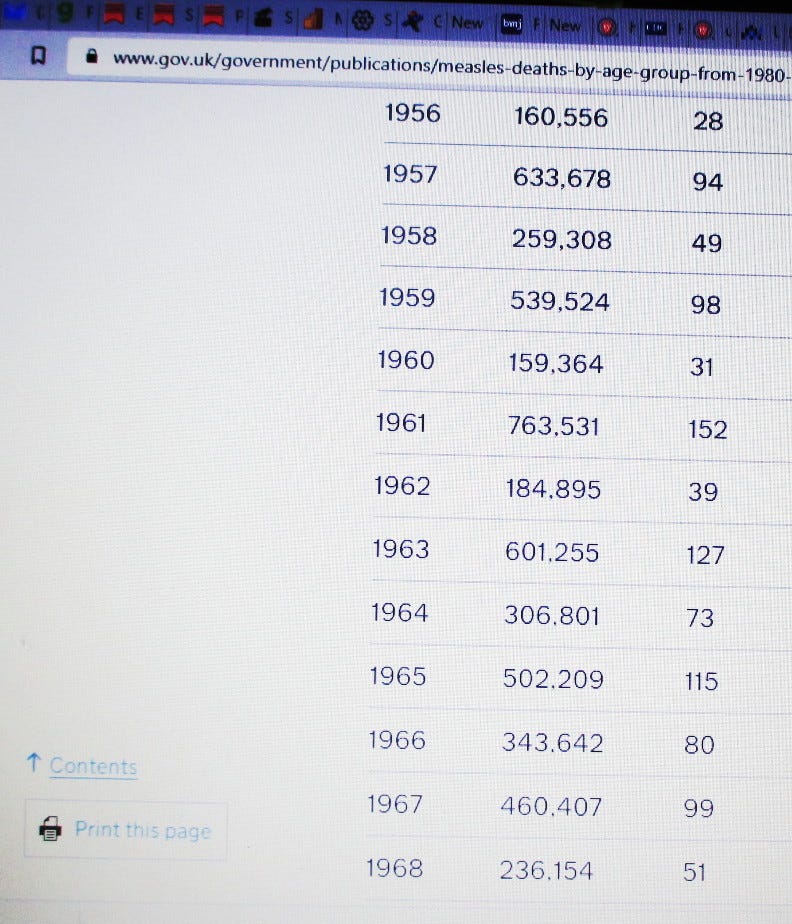
https://www.gov.uk/government/publications/measles-deaths-by-age-group-from-1980-to-2013-ons-data/measles-notifications-and-deaths-in-england-and-wales-1940-to-2013
Population of England and Wales:
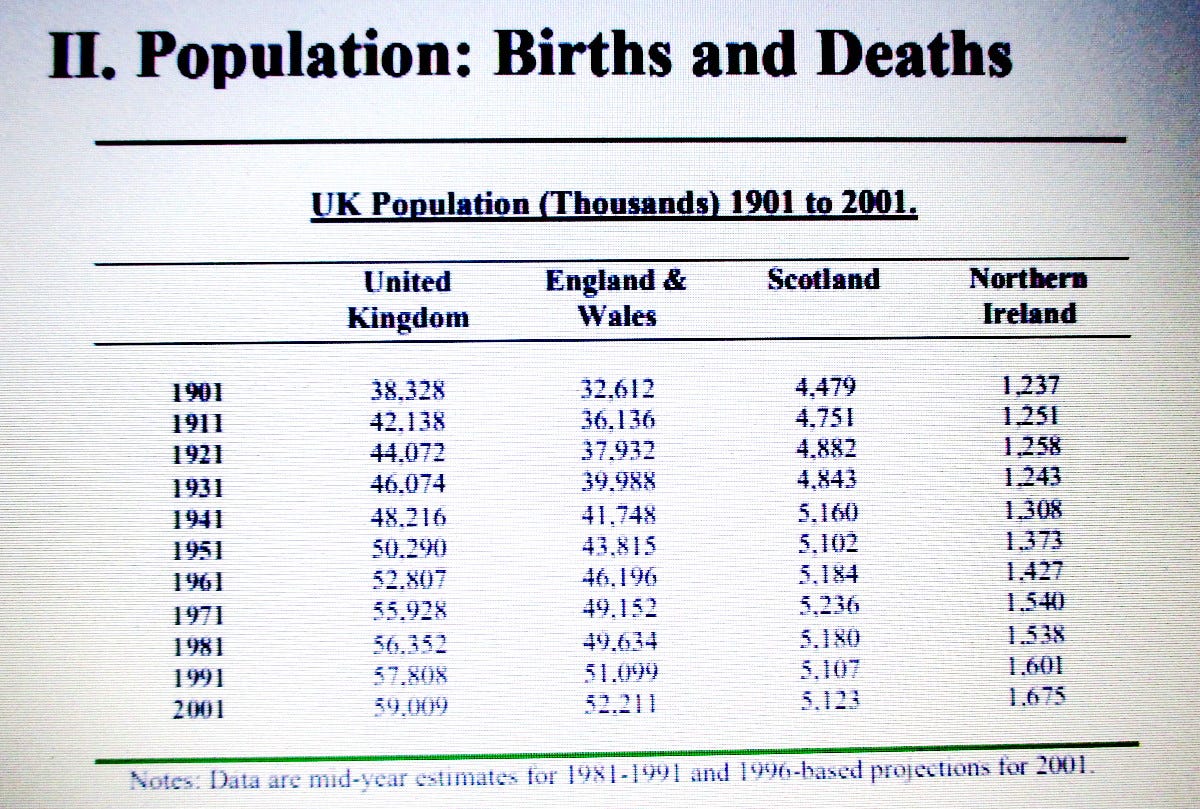
https://researchbriefings.files.parliament.uk/documents/RP99-111/RP99-111.pdf
Appendix 2: possible data biases
Consider the following hypothetical scenario:
Group A: 100,000 person-years, 12 deaths = 120 deaths per million person-years
Group B: 100,000 person-years, 10 deaths = 100 deaths per million person-years
Looks like Group B did much better, right? Not so fast…
Say Group A included 20,000 individuals with very serious health conditions, 10 of whom died during the studied period, but none of Group B were in such poor condition.
Then, among the healthy subset of Group A, we have only 2 deaths among 80,000 person-years, or only 25 deaths per million person-years, which corresponds to 1/4 of the rate for those among Group B of comparable baseline health.
Typically vaccines are not administered to people who have life-threatening conditions, a statistical phenomenon named “healthy vaccinee bias” or “healthy user bias”. However, the reverse situation could also be in play in the UK, where the government agencies recommend the jabs for children with poorly functioning immune systems, as noted above, which would then include those who are most susceptible to COVID. So, in this case, we could have a very messy stew of conflicting factors.
So, bear such considerations in mind when examining the data. The data could be misleading either way out of sufficient context. I would really like to see the figures for kids with no pre-exiting health issues whatsoever. But these figures are the best we have.
Footnotes
1. “Boosted” was not defined, but I would expect it to mean an additional of the “1 jab” shots, such as Astra Zeneca.
2. When downloading the spreadsheet, please note that the tables for different data sets are indicated by the tabs at the bottom of the spreadsheet. When mine came up all I saw was cover page, which was the first tab on the bottom ribbon. The data for 10 to 14 year-old children are found in Table 6 (see bottom bar of the spreadsheet).
Hello from the UK
Many thanks for your post. It is awful, but then it always has been awful, big pharma have been in this game for decades.
The thing about measles is that in fact all internal diseases are toxic poisoning with symptoms remarkably similar when looked at in the round and compared with other so-called diseases.
What would be interesting is to tie up past vaccination programs and uptake in the population with deaths as I would expect a correlation.
My son has Down syndrome and Diabetes T1, along with a thyroid condition.
These are well managed with conventional medication and he is a fit and healthy young man of 30.
In my view, an experimental mRNA vaccine might have been fatal, but he usually shrugs off colds and is very rarely sick, because he gets to walk, ski, swim, and eats a healthy diet. (Vit D and C etc)
so: No jabs! Not for him, and not for us, in our active and healthy early 70's.
(PS, he did test positive at least once for Covid, but shrugged it off. The evidence base is totally lacking that ALL immunocompromised but otherwise healthy young people with a sensible diet and good physique and tone are at the slightest risk at all of Covid. )